What does fuel-efficient driving achieve? The answer is not about fuel
If you have met this question on a theory test, the answer is improved road safety. The other three options — increased fuel consumption, increased exhaust emissions, damage to the environment — are the outcomes fuel-efficient driving avoids, which is what makes the question look like a trick the first time you read it.
It is not a trick. It is the whole point, and it is worth a minute even if you passed your test twenty years ago and run forty vehicles.
Why road safety is the answer
DVSA's explanation turns on hazard awareness and planning ahead. A driver who is looking far enough up the road has time to deal with what is coming without braking hard, and a driver who is not has to make the vehicle do the work instead.
Everything people call fuel-efficient driving follows from that one habit. Reading the traffic, leaving a gap, carrying momentum, coming off the throttle early rather than braking late — none of those are fuel techniques. They are anticipation, and lower fuel burn is a by-product of it.
So the honest shape of the question is: fuel-efficient driving is not a thing you do to save fuel. It is what safe, planned driving looks like from the fuel tank's point of view. The emissions and the economy come along behind.
The professional version says the same thing
This is not only a learner's question. DVSA's Driver CPC syllabus covers optimising fuel consumption by name, and the things it lists under it are anticipating traffic flow, distance to other vehicles, momentum and speed, smooth driving style, tyre pressure and in-vehicle systems.
That is the theory test answer again, written for somebody who drives for a living. The learner is told anticipation keeps them safe; the professional is told anticipation is how the fuel is managed. One skill, two statements of what it produces — which is why training that goes beyond the CPC minimum tends to show up in both the incident log and the fuel figures rather than one of them.
What a percentage point of MPG is worth now
| Period | Value |
|---|---|
| 2018 | 130p |
| 2019 | 131.7p |
| 2020 | 119.5p |
| 2021 | 135p |
| 2022 | 177.8p |
| 2023 | 158.1p |
| 2024 | 148.4p |
| 2025 | 142.7p |
| 2026 | 173p |
Use this chart
Free to use on your own site, in a report or in training material, as long as the credit link stays on it. The figures are FleetOptix's working of a published data set — the source is named above, and you should cite that too.
<figure>
  <img src="https://fleetoptix.co.uk/charts/what-does-fuel-efficient-driving-achieve/0.svg" alt="UK average diesel pump price, annual average — FleetOptix" width="720" height="364" loading="lazy">
  <figcaption>
    Chart by <a href="https://fleetoptix.co.uk">FleetOptix</a>
  </figcaption>
</figure>Or take the file on its own: download the SVG.
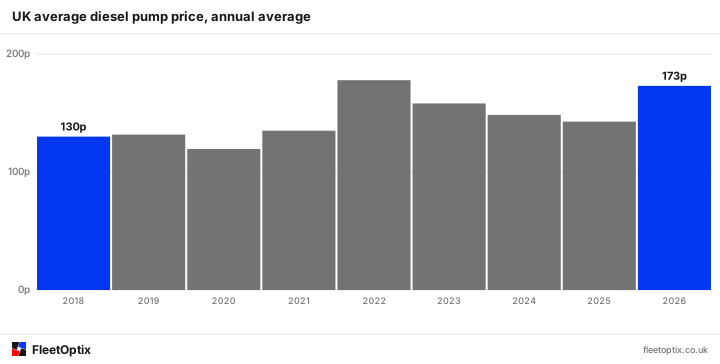
Diesel at the pump passed 200p a litre for the first time in this series on 12 October 2026, at 200.04p, and sat at 199.33p the following week. The 2026 average so far is 173.0p against 130.0p in 2018.
Which is the practical case for caring about driving style, and it is arithmetic rather than opinion: the same percentage of MPG is worth a third more than it was eight years ago. Nothing about the technique changed. The price of not using it did.
And it is not tax
| Period | Value |
|---|---|
| 2018 | 50.4p |
| 2019 | 51.8p |
| 2020 | 41.6p |
| 2021 | 54.6p |
| 2022 | 94p |
| 2023 | 78.8p |
| 2024 | 70.7p |
| 2025 | 66p |
| 2026 | 91.3p |
Use this chart
Free to use on your own site, in a report or in training material, as long as the credit link stays on it. The figures are FleetOptix's working of a published data set — the source is named above, and you should cite that too.
<figure>
  <img src="https://fleetoptix.co.uk/charts/what-does-fuel-efficient-driving-achieve/1.svg" alt="The part of the diesel pump price that is neither duty nor VAT — FleetOptix" width="720" height="364" loading="lazy">
  <figcaption>
    Chart by <a href="https://fleetoptix.co.uk">FleetOptix</a>
  </figcaption>
</figure>Or take the file on its own: download the SVG.
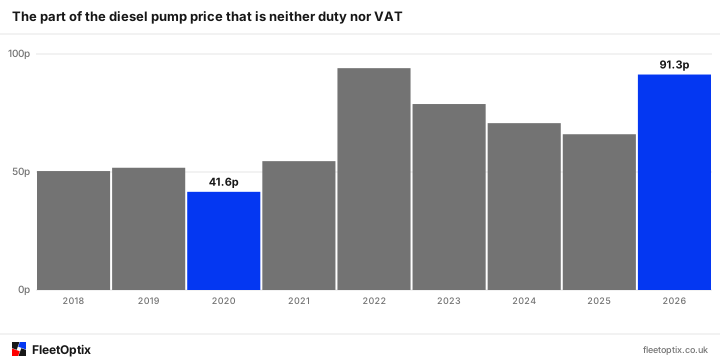
Fuel duty on diesel was 57.95p a litre in 2018 and is 52.95p now, so the rise in the pump price has happened despite the tax on it falling. The part that moved is the fuel and the supply chain behind it, which no operator has any influence over at all.
That is the useful division. The price per litre is somebody else's decision. The litres are partly yours.
What else it achieves, beyond the tank
The theory test answer is about safety, and on a commercial fleet that cashes out in places that have nothing to do with diesel.
- Brakes. Anticipation means fewer hard stops, and brake wear is one of the costs that scales directly with how a vehicle is driven.
- Tyres. Harsh acceleration and late braking are what scrub them, and tyres are among the defects most often found at the roadside.
- Prohibitions. A vehicle driven hard presents more defects, and defects found at a roadside check do not stay at the roadside — they reach the operator's record.
- Collisions, and everything attached to them: downtime, excess, premium, and the investigation that follows.
- Load. Smooth inputs are what keep a load where it was put, which is the other half of load security.
- Drivers. Anticipation is less tiring than reacting, over a ten-hour day.
None of that is visible in a fuel report. It is visible in the defect trend, the prohibition record and the insurance renewal, which is why fuel-efficient driving is better treated as a driving standard than as a fuel initiative.
Ecosafe driving, and the best speed question
Ecosafe driving is the same thing under an older name — DVSA used it for years and plenty of training material still does. If you have met the question as what does ecosafe driving achieve, the answer has not changed: it is the safety one, for the same reason.
The techniques underneath it are short enough to list, and none of them is a secret.
- Look far enough ahead to see the stop before the brake lights do.
- Leave a gap, which is what makes early, gentle inputs possible at all.
- Come off the throttle rather than onto the brake, and let the vehicle carry its own momentum.
- Change up early and sit in the highest gear that is comfortable.
- Stop idling. A stationary engine is producing emissions and moving nothing.
- Check tyre pressures — the syllabus names them, and so does a proper walkaround check.
- Take the weight out: roof equipment, empty racking and a tank filled fuller than the day needs all cost something to carry.
People often want a number for the last piece of this — the best speed for fuel economy. There is not a single one, and most of the figures in circulation are for cars. What is true for any vehicle is that aerodynamic drag rises with the square of speed, so each extra mile an hour at motorway pace costs more than the one before it, and an HGV with the frontal area of a wardrobe feels that harder than a hatchback does.
In practice the top end is already decided for a goods vehicle: the speed limiter sets it, and the road sets it below that. The variable left is how steadily the speed is held, and that is the one anticipation controls. A vehicle that cruises at a constant 52mph will beat one that oscillates between 45 and 56 getting to the same place at the same time, because every one of those recoveries was paid for in fuel.
How you would know it was working
This is the part most fleets skip. A toolbox talk about smooth driving produces a feeling that something improved, and a feeling is not a measurement.
- Fuel against distance, per vehicle, over time — the reconciliation that shows a drift before anyone notices it by eye.
- The same figure per driver where a vehicle is not fixed to one, which is the only version that can tell a driving problem from a vehicle problem.
- Harsh event counts from telematics, remembering that telematics answers what is happening and a compliance record answers what has been done.
- Brake and tyre replacement intervals, which move slowly and lie less.
- A short end-of-shift conversation rather than a monthly league table, because the person who can explain a bad week is the one who drove it.
- Whichever of those you pick, as a tracked figure rather than an impression.
One thing worth knowing before you buy anything: the savings figures quoted for eco-driving training vary enormously, the larger ones tend to be measured on the day of the course rather than a year later, and most of them are published by the people selling the course. Measure your own fleet before and after. It is the only number that applies to you.
The short answer
Fuel-efficient driving achieves improved road safety. It also achieves lower fuel consumption, lower emissions and slower wear, but those are consequences of the thing it actually is — looking far enough ahead that the vehicle never has to be rescued from a situation the driver could have seen coming.
On a test paper that is one mark. On a fleet of forty it is the difference between a driving standard and a fuel policy, and only one of those is worth writing down.
- The theory test answer is improved road safety — the other options are what fuel-efficient driving avoids.
- The mechanism is anticipation: planning far enough ahead that hard braking is not needed. Lower fuel burn is a by-product.
- DVSA's Driver CPC syllabus names the same things — traffic flow, distance, momentum, smooth style, tyre pressure — under optimising fuel consumption.
- Diesel averaged 173.0p a litre in 2026 against 130.0p in 2018, so the same percentage of MPG is worth about a third more than it was.
- Duty fell from 57.95p to 52.95p over that period: the rise is the fuel and its supply chain, not the tax.
- Measure it per vehicle and per driver over time. The published savings figures for training are mostly old, mostly vendor-published, and not about your fleet.
- GOV.UK: theory test for cars — the official test, and where the current revision materials are listed
- DVSA: Driver CPC syllabus — names anticipating traffic flow, distance, momentum, smooth driving style and tyre pressure under optimising fuel consumption
- DESNZ: weekly road fuel prices — the weekly pump price and duty series behind both charts, published since 2003
- GOV.UK: Driver CPC training for qualified drivers — the periodic training requirement the syllabus above sits under
Links checked 24 October 2026. Published guidance changes; where a figure matters to a decision, confirm it against the source rather than against this page.
About this article
The FleetOptix team
Written by people who work daily with fleet operators on drivers' hours, tachograph records and the paperwork that holds up under a DVSA inspection. Regulated detail is attributed to the body that sets it rather than asserted here, and the sources are listed above.
- Published
- 24 October 2026
- Last revised
- Not since publication
- Topic
- Operations
How this is researched, dated and corrected is set out in our editorial standards. If something here is wrong or out of date, email hello@fleetoptix.co.uk — corrections to a regulated detail are made as soon as we can confirm them, and the revision date above moves when they are.