DVSA operator assessments: why 92% come back unsatisfactory
DVSA publishes the outcome of every maintenance assessment it carries out on a goods or passenger operator. In the first quarter of 2026 to 2027 it recorded 175 assessments of HGV operators, and 92% of them came back unsatisfactory.
That number is real and it is DVSA's own. It is also the most misread figure in transport compliance, because it is routinely quoted as though it described the industry. It does not. It describes the operators DVSA chose to look at.
| Period | Value |
|---|---|
| 2013 to 2014 | 79.9% |
| 2014 to 2015 | 77.6% |
| 2015 to 2016 | 73.7% |
| 2016 to 2017 | 69.7% |
| 2017 to 2018 | 71.5% |
| 2018 to 2019 | 70.3% |
| 2019 to 2020 | 72.9% |
| 2020 to 2021 | 77.8% |
| 2021 to 2022 | 77.3% |
| 2022 to 2023 | 84% |
| 2023 to 2024 | 87.4% |
| 2024 to 2025 | 91.3% |
| 2025 to 2026 | 91.1% |
| 2026 to 2027 (Q1) | 92% |
Use this chart
Free to use on your own site, in a report or in training material, as long as the credit link stays on it. The figures are FleetOptix's working of a published data set — the source is named above, and you should cite that too.
<figure>
  <img src="https://fleetoptix.co.uk/charts/dvsa-operator-assessment-failures/0.svg" alt="Unsatisfactory outcomes as a share of HGV maintenance assessments — FleetOptix" width="720" height="364" loading="lazy">
  <figcaption>
    Chart by <a href="https://fleetoptix.co.uk">FleetOptix</a>
  </figcaption>
</figure>Or take the file on its own: download the SVG.
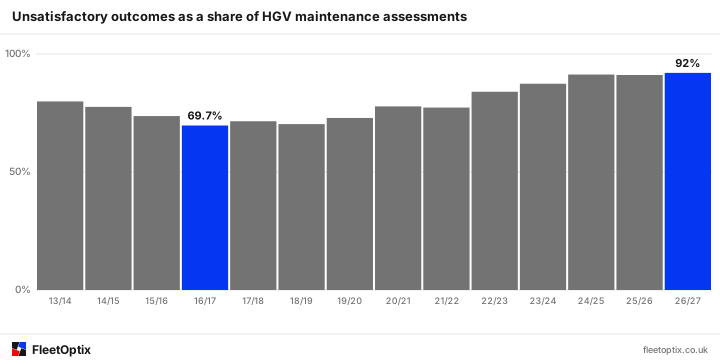
The rate went up because the sample got smaller
The two series that matter move in opposite directions. In 2013 to 2014 — the last year before VOSA became DVSA — the agency carried out 2,690 HGV maintenance assessments and 79.9% were unsatisfactory. By 2016 to 2017 it was carrying out 936 and the rate had fallen to 69.7% — the lowest in the published record. Since then the number of assessments has settled at roughly 830 a year while the unsatisfactory rate has climbed every year, through 84.0% in 2022 to 2023, 87.4% the year after, and 91.3% in 2024 to 2025.
A third fewer assessments and a much higher failure rate is what targeting looks like. DVSA does not assess a random sample of operators. It assesses the ones its intelligence, its OCRS scores and its roadside encounters have already flagged, and it has got better at choosing them. A rising rate against a flat volume is a statement about DVSA's targeting, not about the state of the industry.
Which cuts both ways. If you are selected for a maintenance assessment, the base rate says you are in a group where more than nine in ten come back unsatisfactory — and that group was not picked at random. Being chosen is itself information.
What an assessment actually examines
A maintenance assessment is a documented examination of how an operator keeps its vehicles roadworthy, carried out at the operating centre rather than at the roadside. It is not a vehicle inspection. The vehicle is evidence; the system that was supposed to keep it right is the subject.
- Safety inspection records, and whether the intervals set were actually kept
- Driver defect reporting — that defects are raised, and more importantly that they are closed
- The audit trail from a reported defect through to the repair and the sign-off
- Whether inspection intervals suit how the vehicles are actually used, not how they were when the licence was granted
- Brake test evidence, and whether it is laden testing of any value
- Who holds responsibility, and whether that person has the time and authority the role needs
The outcome is recorded as satisfactory or unsatisfactory, and the unsatisfactory finding is what feeds the next step — which may be a follow-up visit, a report to the Traffic Commissioner, or in the more serious cases a referral that ends at a public inquiry.
Goods operators fail more often than passenger ones
| Period | Value |
|---|---|
| HGV 2013 to 2014 | 79.9% |
| PSV 2013 to 2014 | 71.6% |
| HGV 2015 to 2016 | 73.7% |
| PSV 2015 to 2016 | 67.9% |
| HGV 2017 to 2018 | 71.5% |
| PSV 2017 to 2018 | 57.6% |
| HGV 2018 to 2019 | 70.3% |
| PSV 2018 to 2019 | 63.4% |
Use this chart
Free to use on your own site, in a report or in training material, as long as the credit link stays on it. The figures are FleetOptix's working of a published data set — the source is named above, and you should cite that too.
<figure>
  <img src="https://fleetoptix.co.uk/charts/dvsa-operator-assessment-failures/1.svg" alt="Unsatisfactory rate by operator type, last six full years of published annual totals — FleetOptix" width="720" height="364" loading="lazy">
  <figcaption>
    Chart by <a href="https://fleetoptix.co.uk">FleetOptix</a>
  </figcaption>
</figure>Or take the file on its own: download the SVG.
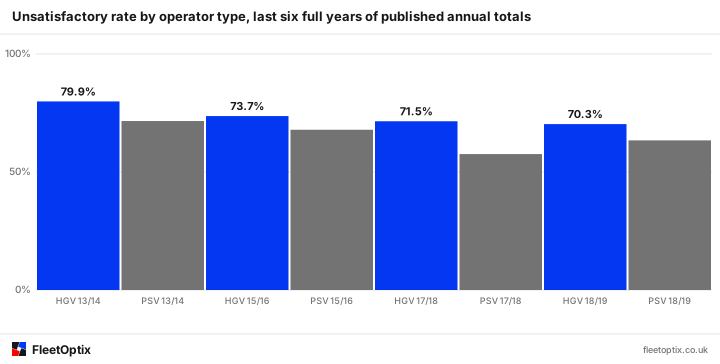
In every year DVSA published an annual total for both, goods operators came back unsatisfactory more often than passenger ones — by around eight points in 2013 to 2014 and by nearly fourteen in 2017 to 2018. Passenger operators are assessed in much smaller numbers, so the gap should be read with that in mind, but the direction is consistent across six years.
What the unsatisfactory findings keep being about
The pattern operators report after an assessment is rarely that the maintenance was not done. It is that it could not be shown to have been done, in the order it happened, by the person who did it.
- Inspection sheets that record a defect with no matching record of the repair
- Intervals set years ago against a pattern of use that has since changed
- Brake tests at inspection that were unladen, and so prove very little
- Driver defect reports kept in the cab, the depot and an inbox, with no single trail
- A nominated transport manager whose time is on paper and not in practice
- Records held in several systems where assembling one vehicle's history takes a day
That last one is the quiet killer. An assessment is a request to produce evidence inside a working day. An operation with genuinely good maintenance and genuinely scattered records fails on the second thing, and the finding reads the same way on the report as if the maintenance had been bad.
What to do if you are selected
- Treat the notice as a request for evidence, not a request for reassurance — assemble, do not explain
- Pull three vehicles at random and build their full history end to end before the visit
- Time that exercise, because how long it takes is what the assessment is really measuring
- Check inspection intervals against how the vehicles are used now, and be ready to justify them
- Find the defects with no closing record first; they are the ones that get written up
- Do not create documents to fill gaps — a reconstructed record found during an assessment is a different and much worse problem
The work described there is the same work described in preparing for a DVSA maintenance investigation. It is also, almost exactly, the work FORS accreditation asks for — which is why operators who hold one tend to find the other straightforward.
Reading the number honestly
92% is not the proportion of operators who would fail an assessment. It is the proportion of a deliberately selected few hundred who did. The industry figure is unknown and this data cannot produce it, because DVSA has never assessed a random sample and has no reason to.
DVSA also states plainly that this data set is not an official statistic and is not scrutinised by the UK Statistics Authority, and that the count of assessments is lower than the number actually carried out because a multi-site assessment is recorded once. Anyone quoting the 92% without those two sentences is quoting it harder than DVSA does.
- 92% of HGV maintenance assessments came back unsatisfactory in Q1 of 2026 to 2027, against 69.7% in 2016 to 2017.
- Assessment volume fell from 2,690 a year to roughly 830 over the same period — the rate rose as the targeting tightened.
- It is a hit rate on operators DVSA selected, not a failure rate for the industry, and cannot be read as one.
- Goods operators came back unsatisfactory more often than passenger operators in every year both were published.
- Most findings are about evidence that could not be produced, not maintenance that was not done.
- DVSA states the data set is not an official statistic; check the current tables before quoting any figure from it.
- DVSA: vehicle enforcement data for Great Britain — the published quarterly tables, which DVSA states are not official statistics
- DVSA: Guide to maintaining roadworthiness — the inspection, defect reporting and record-keeping standard DVSA assesses operators against
- Senior Traffic Commissioner: statutory document summaries — the published guidance Traffic Commissioners decide cases against
Links checked 22 October 2026. Published guidance changes; where a figure matters to a decision, confirm it against the source rather than against this page.
About this article
The FleetOptix team
Written by people who work daily with fleet operators on drivers' hours, tachograph records and the paperwork that holds up under a DVSA inspection. Regulated detail is attributed to the body that sets it rather than asserted here, and the sources are listed above.
- Published
- 22 October 2026
- Last revised
- 22 October 2026
- Topic
- Operator Licence
How this is researched, dated and corrected is set out in our editorial standards. If something here is wrong or out of date, email hello@fleetoptix.co.uk — corrections to a regulated detail are made as soon as we can confirm them, and the revision date above moves when they are.